
Light Sensor to measure the Rate of Reaction ( Iodine Clock )
Conventional Way (X cross Method)
Light Sensor Method (Accurate)
Comparative study can be conducted to decide which method is more accurate.
Iodine Clock Introduction.
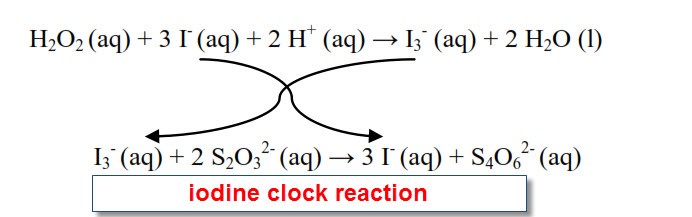
H2O2 oxidises I- into I3 and I3 will react with starch to form blue black.
H2O2 + 3 I − + 2 H+ → I3− + 2 H2O.
Triiodide formed will be reconverted to iodide by the thiosulfate. (Delaying mechanism) .
I3−(aq) + 2 S2O32−(aq) → 3 I−(aq) + S4O62−(aq)
Reaction Mechanism
Light Intensity MUST drop immediately when blue black colouration forms.
Research Question?
How will changing KI conc affect the rate of Iodine Clock Reaction ( monitored by the sudden drop in light intensity ) over time.
Steps to follow
1.Prepare 2 fold serial dilution for 0.1M KI

2.Add (0.5ml, 0.1M S2O3) , (0.5ml, 0.5M KI), (0.1ml 1% starch), (0.1ml, 0.1M HCI) into a cuvette.
2. Light sensor (0-6000) lux range, 20W bulb
3. Place cuvette above the sensor
4. Set up light sensor for 300s
5. Add 1ml 3%H2O2 using micropipette into cuvette and press data collection button simultaneously

7. Blue black will cause light intensity to drop
8. Rate measured by time taken for light intensity to drop.
9. Triplicate for each Conc and take average time.
Advantage of light sensor and Tips to make it work
- Light intensity MUST immediately drop once blue black form
- Reduce human error ( X method )
- Micro volume is used, save reagents (total volume 1.5ml )
- Must use light source above the cuvette
- Set light sensor to most sensitive range ( able to sense slight change in light intensity)
- Dont need to calibrate sensor and can start at any light intensity ( we measure only drop in intensity )
- Sulphur clock may be adopted ( sulphur formation ) but may NOT BE ACCURATE cause sulpur will not block the light well and it will not be a drastic drop in light intensity
Iodine Clock light sensor (accurate if you perform it correctly)
IB students are risk takers, innovators, creative, adopt new techniques for iodine clock.
Other iodine/sulphur clock that can be measured using light sensor
- Sulphur Clock ( acid with thiosulphate for sulphur formation )
- Iodine Clock between Peroxodisulphite S2O82− and potassium iodide, KI
...................................................................................................................................................................
Visible Spec to measure Rate of Reaction (Iodine Clock)
Conventional Way (X cross Method)
- Time for triiodide/starch to obscure a mark “X”.(subject to lots of Human Error)
Visible Spectrophotometer (Change in Absorbance at 608.7nm)
- Time for triiodide/starch to form, causing an increase in absorbance.(Accurate)
Comparative study on both Methods can be done by students
Iodine Clock Introduction
H2O2 oxidises I- into I3 and I3 will react with starch to form blue black.
H2O2 + 3 I − + 2 H+ → I3− + 2 H2O.
Triiodide formed will be reconverted to iodide by the thiosulfate. (Delaying mechanism) .
I3−(aq) + 2 S2O32−(aq) → 3 I−(aq) + S4O62−(aq)
Reaction Mechanism
Absorbance MUST increase immediately when blue black colouration forms.
Research Question?
How changing KI conc affect the rate of Iodine Clock ( by the sudden increase in absorbance ) over time.
Steps to follow
1. Prepare 2 fold serial dil for 0.1M KI
2. Add (0.5ml, 0.1M S2O3) , (0.5ml, 0.5M KI), (0.1ml 1% starch), (0.1ml, 0.1M HCI) into a cuvette.

3. Set visible spec at 608.7nm
4. Set data collection to 300s (Abs vs time)
5. Place cuvette containing solution in step 2
6. Add 1ml of 3%H2O2 and press collect button
7. Take time for absorbance to increase
8. See 2min video tutorial for clarification

Data done by IB students
Rate is measured by time it takes for an increase in absorbance using different KI Conc
Video, Iodine clock reaction using Visible Spec
Advantage of Visible Spec and Tips to make it work
- MUST produce a sharp increase in absorbance once blue black form
- Reduce human error ( X method )
- Micro volume is used, save reagents (total volume 2.5ml )
- DO NOT NEED TO CALIBRATE but ensure wavelength at 608.7nm
- MUST add H2O2 into cuvette and start data collection simultaneously
- Uncertainty can be measured easily ( see picture )
- Sulphur clock may be adopted ( sulphur formation ) but may NOT BE ACCURATE cause sulpur formation may not produce a sharp increase in absorbance

Uncertainty in time when absorbance changes
Increase Accuracy if increase from 1s to 0.1s per sample ( see picture )
........................................................................................................................................................................................
Iodine Clock Reaction Peroxodisulphite S2O82− and Potassium iodide, KI
- Iodine is generated:
- 2I− + S2O82− → I2 + 2SO42−
- I2 + 2S2O32− → 2I− + S4O62−
Same Method but using S2O82− as oxidising agent not H2O2
Steps to Follow

1. Prepare 2 fold serial dilution for 0.1M
2. Add 0.5ml 0.1M KI, 50ul 1% starch, 50ul 0.02M S2O3 into cuvette
3. Set visible spec at 608.7nm
4. Set data collection to 300s (Abs vs time)
5. Place cuvette containing solution in step 2
6. Add 0.5ml of 0.05M S2O82-and press collect
7. Take time for absorbance to increase
8. See 2min video tutorial for clarification
IB Student data, Iodine clock with different conc KI

Results:
- Visible is accurate if it shows a sharp increase in absorbance
- H2O2 is better compared S2O82-
- Comparative study between X cross method, visible and light sensor can be investigate and error analysis can be done
Video, Iodine Clock using visible spectrophotometer
To all IB students,
- Try out new techniques and embrace ICT in your data collection.
- Be risk takers and Try path less travel
- Time to move away from X cross method
- Embrace new techniques and explore new ways of doing things
- Innovate and be creative as that is the path to success.
IB Biology IA, EE on enzymes kinetics amylase using Visible spectrophotometer
EE and IA on enzyme study is safe, easy and doable for IB students
Starch digestion using Amylase
Source for amylase from bacteria, malt or salivary amylase.
Introduction
2 methods to quantify rate of starch digestion ( Abs vs time and Abs vs conc )
1st Method-(Abs vs Time)
Starch + iodine will form blue black colouration (abs at 576nm )
Absorbance drop as starch digested, blue black turn colourless
Measure absorbance change over 120s, digestion of starch by amylase.
Research Question
How changing Temp affect the rate of amylase digestion of starch ( by monitoring the absorbance change over time)

Set up
1. 1ml 0.01% starch in cuvette
2. 40ul Iodine (adjust vol) for a blue black
3. Set absorbance at 576nm
4. Place cuvette in spec and set to Abs vs time
5. Add 10ul 1% amylase into cuvette
6. Start data collection immediately
7. Rate of digestion = Absorbance change over 120s
Treatment of amylase at diff Temp

8. Incubate 0.5ml 1%amylase at different temp for 10mins
9. Starch sol must also be at the same temp as amylase.
9. After 10min repeat step 1 to 5 by adding treated amylase and measure absorbance over time
Treatment of amylase at diff salt Conc
Student data on effect of salt conc on amylase activity

Set up
1. 1ml 0.01% starch in cuvette
2. 40ul iodine (adjust vol) for a blue black
3. Set absorbance at 576nm
4. Place cuvette in spec and set to abs vs time
5. Add 10ul 1% amylase into cuvette
6. Start data collection immediately
7. Rate of digestion = Abs change over 120s
Treatment of amylase at diff Salt Conc
8. Incubate enzyme at different salt conc for 20mins
9. After 10min repeat step 1 to 5, adding treated amylase and measure abs over time add 20ul now as enzyme has been diluted )
...................................................................................................................................................................
2nd Method (Abs vs Conc) suitable for EE
How changing Temp affect amylase digestion of starch (Change in Starch Conc over time )
Part 1. Standard Calibration Curve for Starch Conc
Starch with iodine solution forms blue black colouration.
1. Prepare 0.01% starch solution ( 0.01g in 100ml )
2. Perform a 2 fold dilution ( 0.01, 0.005, 0.00250, 0.00125, 0.000625%)
3. Add 2.5ml 0.01% starch to cuvette
3. Add 40ul 1% iodine solution ( adjust volume accordingly to obtain appropriate blue black)
4. Set visible spec at 576nm
5. Prepare a blank ( 1ml water + 1ml iodine ) and calibrate it (zeroize it)
6. Prepare cuvette (2.5ml 0.01%starch + 40ul iodine) and measure absorbance at 576nm
7. Repeat step 6 with different starch conc and plot std calibration curve.

Hints and tips
- Starch iodine must be dilute as Beer's Law, works for diluted solution.
- Prepare fresh starch solution
- Volume of 1% Lugol Iodine must be adjusted accordingly so a blue black is formed.
Part 2
Expt set up
1. 1ml 0.01% starch in cuvette
2. 40ul iodine ( adjust vol) for a blue black
3. Set absorbance at 576nm
4. Place cuvette in spec and set to abs vs time
5. Add 10ul 1% amylase into cuvette
6. Start data collection immediately
7. Rate of digestion over 120s = (Initial -Final) Abs = (Initial -Final) Starch Conc
8. From Std curve of Absorbance and Starch Conc

9. Initial Abs (0.6) = Initial Starch Conc (0.0084%)

10. At 120s, measure the Abs
11. Final Abs (0.54) = Final Starch Conc (0.0075%)
12. Enz activity = Change in Starch Conc
13. (0.0084-0.0075)/120s = (7.5x10^-6)%/s
Treatment of amylase at diff Temp
14. Incubate 0.5ml 1%amylase at different temp for 10mins
15. Starch sol must also be at the same temp as amylase.
16. After 10min repeat step 1 to 5 by adding treated amylase and measure absorbance after 120s
17. Find Ini/Final Starch Conc shown above
...............................................................................................................................................................
Video, Starch/Iodine Standard Calibration Curve
Tips to make it work
- Starch must be freshly prepared and accurate
- Volume iodine adjusted accordingly to get blue black colouration
- Blue black colouration must be dilute so Beer's Lambert Law is obeyed
- Trial and error needed to get the right Starch/iodine solution for this study
- Prepare a large stock of 0.01%starch/iodine and add 1 ml to cuvette instead of adding 1ml starch and 40ul iodine to cuvette ( pipetting error)
- Make sure use Lugol's Iodine (I2+KI) as Iodine will not work.
EE topics on Enzymatic study
Interesting to find out the efficiency of our own salivary amylase
- Investigation on the effects of pH, Salt, Temp and heavy metal inhibitors on Human salivary Amylase using Visible Spec for quantification.
- Comparative study on effectiveness of amylase from diff organs (salivary vs pancreatic ) or diff source (salivary, malt, fungi (Amyloglucosidase)
- Effect of calcium ions on amylase activity ( Amylase is calcium dependent enzyme )
Diff amylase be purchased from HERE(Carolina)
Source for info, Click HERE
Hope you find joy and passion on doing Science EE Research.........................Lawrence Kok
....................................................................................................................................................
IB Biology IA, EE, enzymes hydrolysis, glucose assay with colorimeter and Sucrose hydrolysis with sucrase
IA and EE on Glucose Quantification

1. 1% glucose std was prepared ( 1g in 100ml )
2. Perform 2 fold serial dilution ( 1%, 0.5%, 0.25%, 0.125% )
3. Add 2 ml of 1% glucose + 2 ml of DNS (3,5 dinitrosalicylic acid) into a 50ml test tube.
4. Repeat step 1 to 3 with different glucose concentration
5. Place all tubes in boiling water bath for 5 mins for colour formation. ( red brown)

6. Transfer 1 ml of sol from tube to cuvette and added 2ml of water to dilute it
7. Set visible spectrophotometer at 487nm.
8. Prepare a blank containing 1ml DNS + 2ml water.

9. Measure absorbance at 487nm
10. Plot std calibration curve
11. Beer's Law works only for dilute solution.
12. Range for glucose ( 1% to 0.01%)
13. Won't work if too little glucose is used
14. Watch video for clarification
Video, Glucose Quantification with DNS/Visible Spec
Click HERE on glucose quantification and preparation of DNS solution.
* Resulting Glucose/DNS solution must be diluted with water as Beer's Law only applies for diluted solution.
*Experimental Kit can be purchased for EE and IA work.
* Glucose sol range must be around 1% to 0.1% for colour determination.
* All item can be purchased from Carolina Biologicals or Kemtecscience
....................................................................................................................................................
IA/EE, Effect of pH,Temp and Salt on enzyme activity (Invertase/Sucrase)
Break down of sucrose into glucose and fructose measured with DNS/Visible Spec
Introduction on Sucrase and DNS

Glucose( reducing sugar) + DNS form a red brown sol.
Fructose, galactose, maltose and all reducing sugar will react with DNS to form red brown solution
Only sucrose, starch and cellulose (non reducing sugar) will not react with DNS
Investigation on Breakdown of sucrose by sucrase and factors affecting it.
Sucrase break down sucrose into glucose and fructose

Glucose + DNS form red brown solution
Steps to follow
1. Prepare 5% sucrase (5g in 100ml buffer pH 7)
2. Prepare 1% sucrose (1g in 100ml )
3. Add 2ml sucrose + 10ul enzyme into a test tube
4. Incubate for 5mins at RT
5. Add 2ml DNS to stop reaction/colour formation.

6. Place test tube with DNS into water bath at 95C for 5 mins for colour formation
7. Remove and cool to RT
8. Add 1.5ml water to tube ( diluted as Beer's Law applies )
9. MUST calibrate with a blank ( as step 1 to 8 without adding sucrase)
10. Positive test ( red brown ) presence of glucose/fructose
picture from
Effect of pH on Sucrase activity

Expt set up
11. Incubate 1ml enzyme + 1ml pH buffer for 5 mins at RT
12. Add 10ul enzyme/buffer to 2ml sucrose, incubate for 5mins
13. Repeat step 5 to 9 and measure Abs at 487nm
Positive control, add 10ul from a tube containing (1ml 5%enzyme + 1ml water)
to 2ml sucrose, then incubate for 5mins
14. Repeat step 5 to 9 and measure Abs at 487nm
Results ( after 300s)

pH Abs
2 0.618
4 0.650
6 0.671
9 0.648
10 0.615

Calc of Glucose from Std Curve ( 300s)
pH 2, Abs = 0.618, Std Curve, glucose is 0.21%
Rate of digestion of enzyme after 300s
= Rate of gluc/fruc produced over 300s
= 0.21%/300s
= 7x10^ -4%/s
Assumptions + Tips to make it work
- Sucrose break down to glucose/ fructose and both reducing sugar react with DNS
- Glucose Std Curve is used instead of glucose/fructose Std ( too tedious)
- Time is major factor and error. The longer incubation, more glucose produced. Time must be properly controlled, reaction is time dependent
- Must be diluted with water ( Beer's Law) and it need some trial and error
- Must always calibrate with blank ( see above )
.....................................................................................................................................................
EE topics
Using this quantification technique on glucose for investigation on
- Hydrolysis of starch by diff amylases (sources) producing glucose
- Factors (pH, ionic salts, temp, inhibitors) affecting enzymatic hydrolysis of starch/sucrose/cellulose using DNS/Visible Spec as quantification method
- Hydrolysis of cellulose with enzyme cellulase ( Biofuel production) producing glucose. Cellulosic ethanol is a biofuel produced from wood, grasses, or the non-edible parts of plts
- Optimization of this technique, more sensitive ( detection below 0.01% glucose ), easy for students to use ( instead of Benedicts and Sugar dip stick)
- Colour stabilisation using potassium sodium tartrate and phenol solution
Click HERE on glucose quantification using DNS
Click HERE on sucrose quantification using DNS
Click HERE for EE Research Questions on enzyme sucrase using DNS
........................................................................................................................................................Beautiful, simple expt but demand lots of analytical skills. You never know what u can do until u try.You may not know what results come from your actions, but if you do not try, there will be no result, Try it out.
IB Biology EE, enzymes kinetics amylase experiment using colorimeter
Introduction
2 methods (Abs vs time or Abs vs conc)
1st Method-(Abs vs Time)
Starch + iodine form blue black colouration (abs at 576nm )
Absorbance drops as starch digested, blue black turn colourless
Measure absorbance change over 120s, digestion of starch by amylase.

Set up
1. 50ul 1% starch in cuvette
2. 20ul iodine (adjust vol) for a blue black
3. Add 2ml water ( dilute it for Beer's Law)
4. Set absorbance at 576nm
5. Place cuvette into spec, set Abs vs time
6. Measure Intial Abs = 0.364

7. Add 20ul 1% amylase into cuvette
8. Start data collection immediately
9. Rate of digestion = Abs change over 120s
8. Final Abs = 0.207
9. Rate of enzyme activity = Abs change/120s
..................................................................
2nd Method (Abs vs Conc)
Click HERE to view how to prepare Std Calibration Curve ( HL students )

Expt set up
1. 50ul 1% starch in cuvette
2. 20ul iodine ( adjust vol) for a blue black
3. Add 2ml water ( dilute it for Beer's Law)
4. Set absorbance at 576nm
5. Blank it with (20ul iodine + 2ml water)
6. Place cuvette in spec, measure Abs
7. Initial Abs = 0.377

8. Remove cuvette out, add 20ul 1% amylase
9. After 120s, place cuvette into spec and measure final Abs
10. Final Abs = 0.226
11. Rate of enzyme activity
= (Initial - Final) Abs
= (Initial - Final) Starch Conc
= Decreased in Starch Conc
12. From Std curve of Absorbance vs Starch Conc

Initial Abs = 0.377, Ini Starch Conc = 0.0051
Final Abs = 0.226, Final Conc = 0.0029
Rate enzyme activity
= Change in Starch Conc/time
= (0.0051- 0.0029)/120s
= 1.83 x 10^-5M/s
Video, Starch Hydrolysis by amylase using Abs/Time or Abs/Conc
....................................................................................................................................................
For HL or EE students
Using DNS method to quantify glucose produced by starch hydrolysis
Click HERE to view glucose quantification with DNS

Steps to follow
- DNS solution = yellow
- Glucose (all reducing sugar ) + DNS = red brown colouration
- Prepare Glucose Std
- Digest Starch/Sucrose/Cellulose with enzymes produce glucose
- React with DNS = red brown
Glucose Std Calibration Curve

3 Ways to quantify starch hydrolysis
- Abs vs Time ( Easy ) for SL
- Abs vs Conc ( Hard ) for HL
- DNS method ( Challenging ) for EE
Trials Result done (More trials needed to perfect this method)
Hydrolysis of starch, sucrose and cellulose by enzymes

DNS = yellow ( no glucose )
DNS + sucrose = yellow ( no glucose )
DNS +sucrose+enzyme = red brown (glucose)
DNS + starch = yellow ( no glucose )
DNS +starch+enzyme =red brown(glucose)
DNS + cellulose = yellow ( no glucose )
DNS+cellulose+enzyme=red brown(glucose)
Limitation and problems encounter in DNS Method
Hydrolysis of starch by amylase produce glucose /maltose

DNS = yellow ( no glucose )
DNS + starch = yellow ( no glucose )
DNS + starch + enzyme = red brown ( glucose )
DNS + enzyme = red brown !!!!!!!!!!! ( glucose )
Means enzyme reacts with DNS producing a colour change or might due to heat or other chemical rxn.
Hydrolysis of Cellulose with enzyme (cellulase)

DNS = yellow ( no glucose )
DNS + cellulose = yellow ( no glucose )
DNS+cellulose + enzyme = red brown(glucose)
DNS + enzyme = red brown!!!!!! ( glucose )
Limitation is enzyme reacts with DNS producing colour.
DNS method, will have to make a few assumptions and modifications
- Absorbance is due to glucose + fructose + amt enzyme added
- Blank it with (enzyme + DNS)
- Absorbance of (starch+enzyme +DNS) - Absorbance of ( enzyme + DNS)
Video, Hydrolysis of Starch/Sucrose/Cellulose with DNS
EE topics
Using this quantification technique on glucose for investigation on
- Hydrolysis of starch by diff amylases (sources) producing glucose
- Factors (pH, ionic salts, temp, inhibitors) affecting enzymatic hydrolysis of starch/sucrose/cellulose using DNS/Visible Spec as quantification method
- Hydrolysis of cellulose with enzyme cellulase producing glucose.
- Optimization of this technique, more sensitive, easy for students to use ( instead of Benedict's and Sugar dip stick)
- Colour stabilisation using potassium sodium tartrate and phenol solution
- Modification of this method, to prevent interaction between enzyme and DNS
- Immobilisation of enzyme on alginate/agar beads, enable us to reuse enzyme and prevent enzyme reacting with DNS
Click HERE on glucose quantification using DNS
Click HERE on sucrose quantification using DNS
Click HERE for EE Research Questions on enzyme sucrase using DNS
Demands great analytical skills. Great failures make great mens and nothing worthwhile in life is ever achieve without great failures/struggles. It is OK to try and fail.


